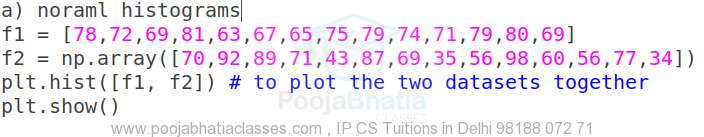
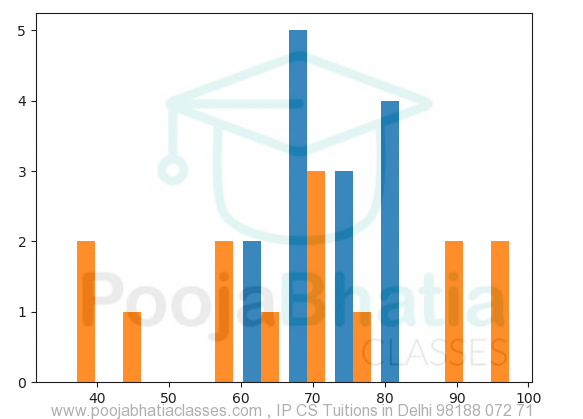
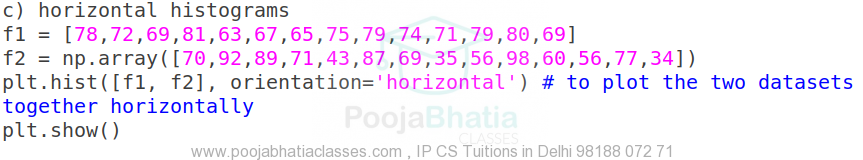
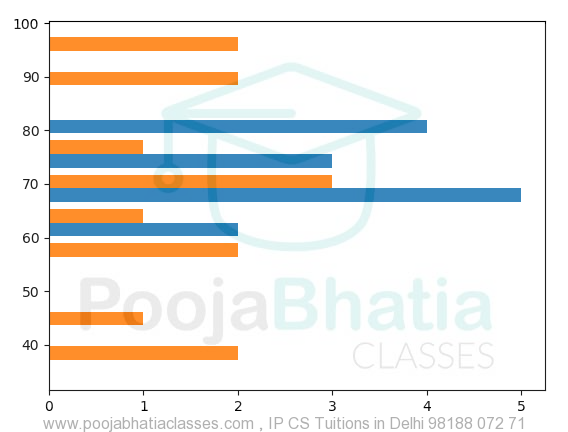
2. Create an ndarray containing 16 values and then plot this array along with dataset of previous question in same histogram / sa 12 ip chapter 4 / By PythonCSIP CS IP