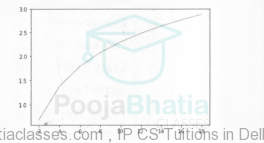
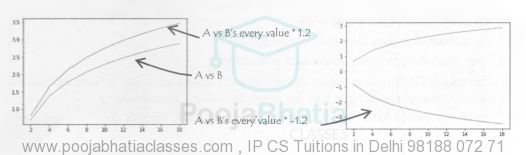
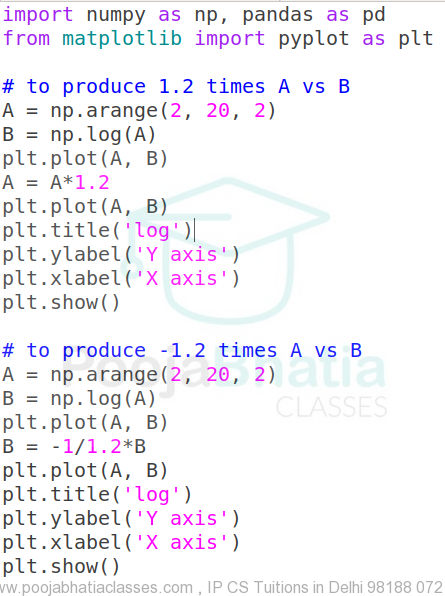
3. plt.plot(A, B) produces (A and B are the sequences same as created in question 2) chart as : / sa 12 cs chapter 8, sa 12 ip chapter 3 / By PythonCSIP CS IP Write codes to produce charts as shown below :